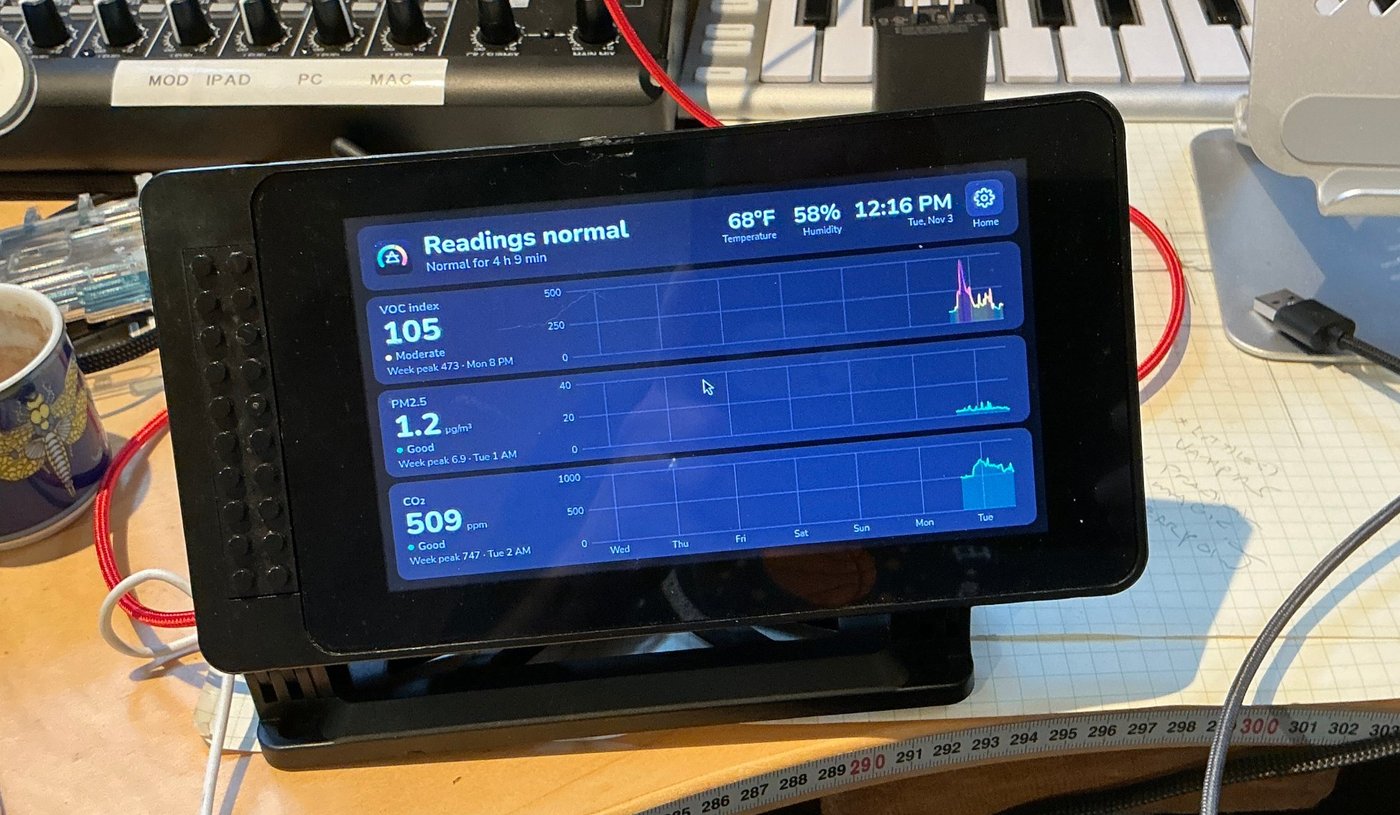
On my desk during testing, a day into its first real readings.
At Seattle Makers one room is used for spray painting and resin printing. An AirGradient ONE monitor measures the air there, but its little display only shows what the air is like right now. A spray session that ended an hour ago leaves no trace. This screen puts the last week of that room’s air beside the door, where anyone can see it at a glance.
What you see
The screen needs no buttons. Across the top is a banner: “Readings normal” or what isn’t, and for how long, with the temperature, humidity and time. Below it are the three readings that matter most in that room, each with a week of history:
- VOC index: fumes from paints, solvents and resin;
- PM2.5: fine particles, such as overspray and sanding dust;
- CO₂: a good stand-in for how stale the air is, and whether the ventilation is keeping up.
Each chart plots the worst minute of every 15 minutes rather than an average, so a 20-minute spray session stands out as a spike instead of being smoothed away. Colours follow the usual bands: green is good, then yellow, orange, red and purple.
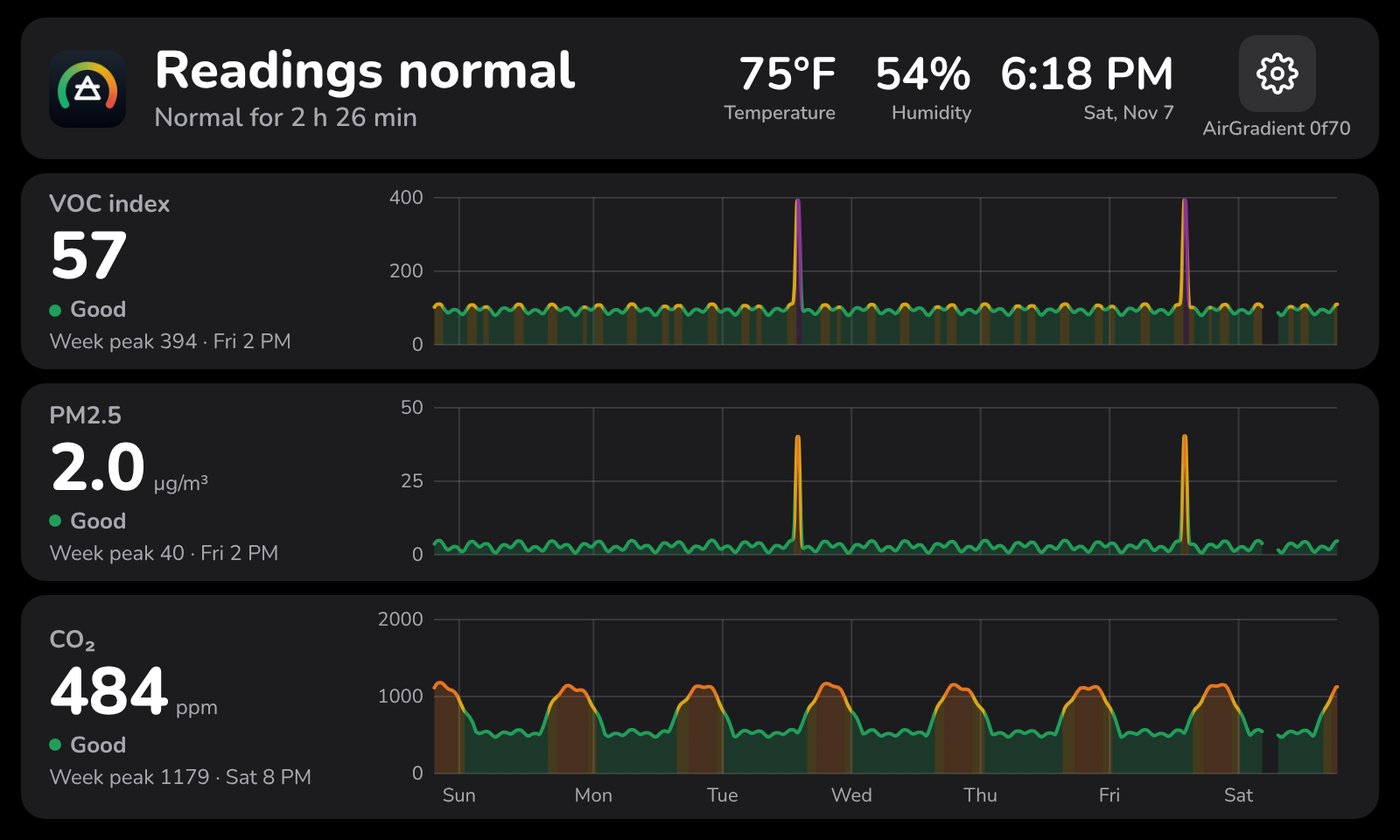
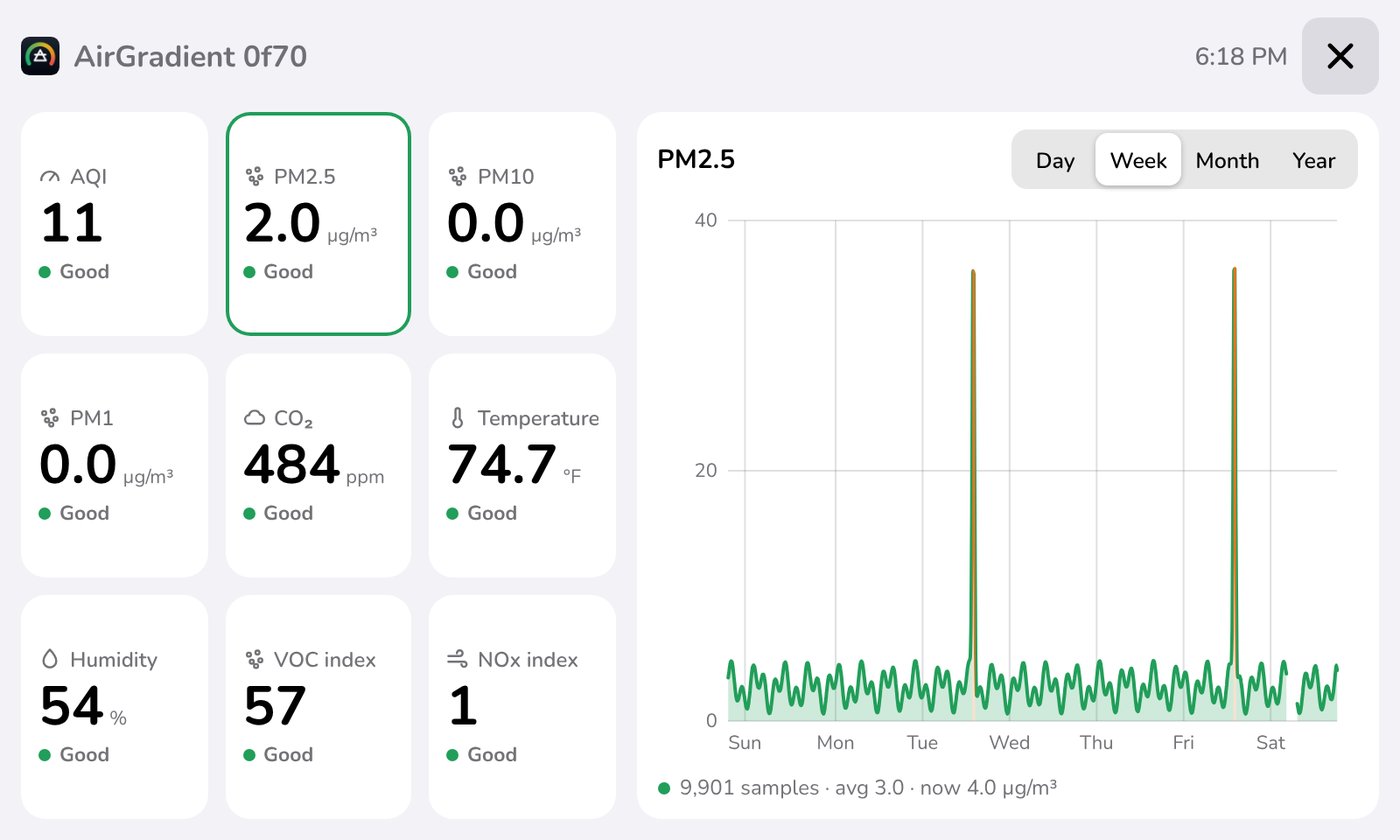
A double tap opens a detail view with every reading and Day, Week, Month and Year charts. Leave it alone and the screen goes back to the room view after three minutes, so nobody can leave it stuck on the wrong page. A gear in the corner opens settings: pick which air monitor is on screen, rename it, join a different Wi-Fi network with an on-screen keyboard, and see the signal. Nothing on the screen can delete readings.
(The screenshots here use made-up sample data with a spray session every few days, so there is something to see in the charts.)
What it can’t tell you
“Readings normal” describes these sensors, not the safety of the room, and the screen is careful never to say “safe”:
- The VOC index is relative. It re-centres on the last day or so of air, so fumes that linger for days drift back toward normal. It shows change, not concentration.
- It can’t detect isocyanates, which two-part paints and clear coats can carry. A calm screen says nothing about them, so keep using the respirator.
- Overspray can foul the particle sensor. If PM2.5 reads high or stuck with nothing going on, suspect the sensor.
Everything lives on the Pi
There is no cloud and no account. The Pi asks the monitor for a reading once a minute over the shop’s Wi-Fi and keeps every one of them on its SD card, about 50 MB a year. Any browser on the shop network can open the same dashboard, or download the whole record as a spreadsheet, but only the screen itself can change anything.
It finds the monitor on its own when it’s set up, and logs any other AirGradient monitors it finds on the network too, each with its own history, so a monitor can move around the shop and keep its record. It names the monitor it’s showing rather than a room, for the same reason.
It’s built to be left alone: it starts the screen by itself after a power cut, waits for the correct time from the internet before recording (a Pi has no clock battery), and never updates itself, so it only changes when someone changes it on purpose.
Inside
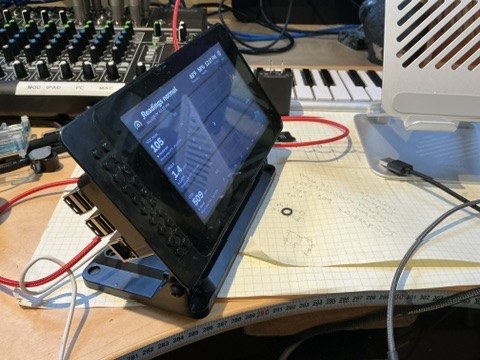
A Raspberry Pi 3 and the official 7-inch touchscreen, in a SmartiPi Touch case, running Raspberry Pi OS Lite. The software is a single small Python program, with nothing beyond what comes with Python, that stores readings in SQLite and serves the dashboard; Chromium shows it full screen. It started from the design of Aetherfield, an iPad app I wrote for AirGradient monitors, but it is its own project.
Links
- Source code, setup and settings guide: github.com/NormSohl/aetherfield-pi
- AirGradient ONE: airgradient.com/indoor